

Introduction
Scientific research has long been recognised as a potentially valuable contribution of the higher education sector. However, recent years have seen increasing scrutiny of how to quantify this value. After all, the financial resources available for science are necessarily finite. Evaluating the relative benefits of different research programmes can help in the allocation of these limited funds. Furthermore, assessing the wider implications of research is a way of systematising a moral obligation that many scientists feel: that they should justify to funders – including the taxpayer – why their research is important.
The wider value of scientific research is usually referred to as (research) impact, and different definitions are adopted in different academic contexts. Typically, however, one identifies one or more target audiences outside academia, and then defines impact as a change in behaviour, knowledge or attitude of the audience(s). This is the approach adopted by the UK Research Excellence Framework (REF, 2019), and an advantage of this definition is its flexibility. For example, the impact may be commercial or policy-based, where appropriate target audiences may include companies or governmental organisations respectively. In this article, however, we are concerned with cultural or societal impact, and the target audience we have in mind is the general public. We may then talk about the reach of any impact (how many people the research influenced), and its significance (how deeply they were affected). While the former can be relatively easy to demonstrate in large numbers (for example, through audience figures for a media outlet), the latter is notoriously difficult to demonstrate.
For certain types of event (for example, those falling under a traditional public engagement banner, such as outreach talks or museum exhibitions), one would usually include the evidencing of impact at the project design stage. Examples include the use of before/after questionnaires, or other similar means of gauging opinion, to explicitly demonstrate that impact has occurred. Indeed, this is usually required by funding bodies. For instance, the UK Research Councils have developed criteria for designing and evaluating public engagement activities, both individually (see, for instance, the Science and Technology Facilities Council’s Public Engagement Evaluation Framework (STFC, 2017)) and through overarching bodies such as the National Co-ordinating Centre for Public Engagement. However, while the significance of impact in such cases can often be well demonstrated, the reach tends to be low.
An opposite case is that of individual research discoveries that are shared widely by the media. Here the reach, as measured by viewing figures or other metrics, can be enormous (the case studies presented in this article involve millions of people). However, this does not by itself demonstrate any impact, as the latter requires an explicit demonstration of behavioural (or other) change, which can be difficult to achieve (Grant et al., 2018). There may be ways around this – such as looking at impact on science journalists themselves, rather than on the public to which they broadcast (Williams, 2019) – but it remains desirable to consider the impact of research on society as a whole. Compounding this problem is the fact that evidence for such impact may need to be collected months, or even years, after a particular discovery has been made. There are several reasons for this, including that:
reaction to a given research event may not be immediate, as it may take some time for its importance to be realised
it may not be realised a priori that a given event will receive widespread attention, and thus mechanisms for recording its impact may not be put in place
a given institution may lack resources or frameworks for systematically evidencing research impact as and when it occurs
changing external factors or assessment criteria for research institutions may create a need for evidence gathering that was absent at the time of the discovery.
The question of how to retrospectively evidence research impact is highly topical, given the growing impact agenda in the UK and elsewhere. Furthermore, analysis of case studies from REF 2014 reveals that public engagement impact is seen as riskier, due to being harder to evidence (Wilkinson, 2019). Worryingly, this may in turn lead to marginalising those areas of ‘pure research’ that are less amenable to measurement by simple metrics (Watermeyer and Chubb, 2019), to the detriment of the self-worth of academics working in such fields (Chubb et al., 2017). For a comprehensive recent discussion of such issues, see Katherine et al. (2020).
A promising new avenue towards demonstrating research impact among a broad public comes from the fact that we are living in a golden age of data science. The ubiquity of computer resources and the internet makes potential sources of evidence both more varied and more voluminous than ever before. This already suggests that a number of different online data sets might be useful for demonstrating impact, relating, for example, to social media or news articles. While some tools exist for analysing such data, however, they are not necessarily geared towards evidencing research impact, as Grant et al. (2018) have recently highlighted. The main reason for this is simply that specialist academic knowledge of the research in question can be useful in informing the design of suitable data-mining tools.
The aim of this paper is to demonstrate several ways in which online data mining can be used to evidence the impact of research discoveries, where the latter may be a few years old. Our target audience will be members of the general public, and the types of change that we will seek to evidence include: (1) widespread discussion of a particular discovery or research event; (2) increased engagement with a broad research area (for example, astronomy) following a specific event; and (3) increased understanding of research topics or details. Importantly, we will try to tie these changes to specific research papers or findings, which are a requirement of some impact assessment exercises. The need to tie impact to specific research papers was a formal requirement in REF 2014, for example, but it has been relaxed slightly (that is, to allow reference to a body of work of associated individuals) in REF 2021 (REF, 2019).
In the next section, we outline the various online data sources that we will consider, and describe the computational methods that we have used to accrue sufficiently large data sets for analysis. After that, we analyse the data we obtained in specific examples of fundamental physics discoveries in the past few years, and present in each case examples of changes in behaviour, knowledge or attitudes. In the final section, we discuss our results and present our conclusions.
A survey of online data sources and ways to interact with them
The internet provides a large number of avenues for the general public to engage with scientific research. Conversely, this allows academics (or other research stakeholders) multiple entry points for evidencing the societal impact of their results.
While each individual site offers unique ways to interact with its material, a generic set of responses has become widely available, summarised in Table 1. These responses require different amounts of time (for example, ‘liking’ a post is faster than writing a paragraph in response to it), and may be more or less public (for example, Twitter ‘likes’ are publicly available, but ‘retweets’ are explicitly drawn to the attention of all followers). This might provide a helpful scale of engagement: responses requiring greater time or social commitment (that is, towards the bottom right corner of Table 1) represent greater engagement.
Schema of different generic ways to engage with online material on news sites or social media (Source: Authors, 2022)
| Time commitment | Social commitment | ||
| Low | High | ||
| Low |
One-click reaction
‘Liking’ material. Reactions may be displayed as a total number and/or used to sort comments. Examples: Twitter ‘likes’, Reddit ‘up/downvotes’, news site reactions. |
One-click recommendation
Sharing results with friends on a social network, without further comment. Examples: Twitter ‘retweets’, news site ‘share’ buttons. | |
| High |
Learning more
Following up references from media, either through explicit hyperlinks or by searching for keywords. Examples: Wikipedia page visitor history. |
Sharing knowledge
Initiating or contributing to ongoing discussion. Examples: Twitter ‘quote retweets’ or new tweets, Reddit replies or new posts, independent blog articles. | |
In this section, we concentrate on several specific sources of online data, and briefly describe how they can be used to construct narratives of behavioural (or other) change.
News articles
While television remains the most popular source of news, its use is falling. On the other hand, news consumption via the internet is rising, with 66 per cent of all UK citizens aged 16 and over relying on it in 2019. This outstrips the figures for radio (43 per cent) and newspapers (38 per cent) (Ofcom, 2019).
Furthermore, internet use dominates over television for two (overlapping) demographics, namely young adults (aged 16–24), and certain ethnic minorities (Ofcom, 2019). From an impact point of view, internet news has a distinct advantage over traditional television or print sources: many news websites allow users to post comments on a story. These comments may be supplemented by additional information, such as a unique name or identifier for the author of each comment, their geographical location, and a date or time stamp for the comment itself. Some news websites allow users to rate comments using likes and dislikes. Three of the most popular news websites in the UK are the Mail Online (an offshoot of the Daily Mail newspaper), BBC News and The Guardian (all of these outlets are free to consume, with no registration required). Each of these three websites allows user comments, although not necessarily on every story. Readership figures and additional comment functionalities are summarised in Table 2.
Reach and comment functionality for three main UK news websites (Source: Authors, 2022)
| News outlet | Readership (millions) | Date and time | Location | Response |
|---|---|---|---|---|
| BBC News | 35 | ✓ | ✗ | +/- |
| Mail Online | 34 | ✓* | ✓ | +/- |
| The Guardian | 24 | ✓ | ✗ | + |
Readership figures correspond to the total unique visitors/viewers in November 2019, taken from comscore.com; ✓* denotes the fact that Mail Online time stamp information becomes incomplete for older comments; + and − indicate whether positive or negative responses to comments are possible respectively.
Popular news stories can generate many (hundreds of) thousands of comments, over a few years in some cases. It is clearly inefficient to collect comments from large numbers of articles by hand. However, the procedure can be automated using well-established computational techniques. More specifically, we have written computer codes in the Python language, which in turn rely on the publicly available packages Selenium (for automated web browsing) and Beautiful Soup (for parsing of website source code in HTML). These can be used to efficiently strip comments from an arbitrary news article associated with a given outlet, although custom codes are required for each news source. For the present study, we have manually searched for news articles relating to specific research results, although this could also be automated in principle.
There is clearly a large amount of information contained in news comments. For example, numbers of comments on any given article, as well as location information, can be used to estimate the (inter)national reach of a given discovery. Numbers of positive and negative responses can evidence which particular aspects of news articles people are most strongly engaging with, and it may be possible to relate such aspects to specific research papers. Of course, a wealth of qualitative information is contained in the text of the comments themselves. For example, one may look for prevalence of keywords in order to ascertain if given topics are being talked about, or for evidence of conversation or debate involving two or more commenters.
Social media
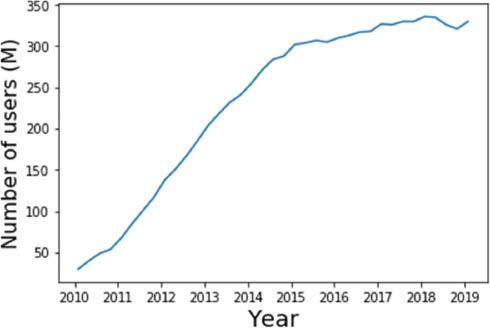
Social media platforms such as Twitter and Facebook allow users to share scientific information (including news articles), and to comment on its significance or implications. Indeed, roughly half of UK adults now use social media for news (Ofcom, 2019). Here, we will focus on the Twitter platform, for which the number of active users has risen remarkably in the past decade, remaining relatively stable from 2015 onwards (see Figure 1). The Twitter website and app allow users to post short (originally 140 characters, 280 from 2017) ‘tweets’ for consumption by their ‘followers’, which may or may not include additional media such as images or web links. Each tweet carries the name of the tweeter (and their unique Twitter handle), as well as date information. Users may reply to the tweets of others, and also ‘retweet’ them, so that they are shared for their own followers to see. Finally, users can ‘like’ the tweets of others, such that any given tweet can be characterised by its number of replies, retweets and (positive) reactions.
Tweets may be mined retrospectively in a similar fashion to the news comments discussed above. Twitter itself provides dedicated packages for Python, which can be used to systematically mine tweet information in real time, or to access past tweets. In particular, one may search past tweets for certain phrases or keywords, including ‘hashtags’ (Twitter’s own special keywords, which are always preceded by the # symbol). Examples of the use of Twitter data are similar to those mentioned for news comments above. However, social media has the advantage that the numbers of people engaging with a given tweet or topic can be much larger: below, we will see examples involving hundreds of thousands of people.
YouTube
YouTube is a global video-sharing platform, with over 1.9 billion logged-in users per month. Anyone can register to upload videos on the site, and the ubiquity and on-demand nature of its content (70 per cent of which is viewed on mobile phones) mean that it is replacing traditional television science content for many people. Examples of research-based videos considered here include those created by public organisations (for example, NASA), journalists and dedicated YouTube science channels. On each YouTube video page, one may easily see the number of views a video has had, and positive and negative reactions (analogous to the likes and dislikes for news articles). Viewers may use the comment facility to respond both to the videos themselves and to each other’s reactions (Dubovi and Tabak, 2020). The sheer number of viewers involved (sometimes several millions) means that a large amount of comment data can be mined, using similar methods to those described above. Each comment has a number of ‘votes’, playing a similar role to the number of positive reactions for news comments. One may also obtain date information for each comment, although this becomes less precise for older comments.
Wikipedia
Wikipedia is a free online encyclopedia, which anyone can edit. It has rapidly become a widely used online resource, replacing traditional print encyclopedias, particularly given its dynamic nature, which means it can respond to events and discoveries in real time. It attracts hundreds of millions of visitors each month, and contains roughly 50 million articles, in 302 languages. Web pages exist for specific topics, and are linked together so that one can easily view pages which are closely related to a given article. Data on Wikipedia usage, including page views in different languages and/or as a function of time, can be easily exported from the publicly available tool Pageviews Analysis. Examples of how to use this data include evidencing the reach of public impact associated with a particular discovery, which is particularly straightforward if a dedicated Wikipedia article exists. Another very useful idea is to look at correlations between different articles: one may try to argue that people who engage with a particular discovery or research result are in turn more likely to read more widely about the underlying subject and context of the research. This narrative becomes particularly powerful if combined with data from one of the alternative sources outlined in the previous sections.
Reddit is a news aggregation and discussion website, which proudly calls itself ‘the front page of the internet’. Users can post texts, web links (for example, to news articles) or images, which are grouped into subject-specific forums or subreddits. Each post can be voted up or down by website members, so that individual posts may move to the top of a given subreddit, or even appear on the main website itself. Reddit is the 18th most visited website in the world, with 42–49.3 per cent of users originating from the US, and 7.9–8.2 per cent from the UK. There are a number of insights that can be obtained from analysing Reddit data. First, there are quantitative metrics, such as the number of posts relating to a given research discovery as a function of time, and the number of upvotes received. Such information can be used alongside similar metrics from analysing Wikipedia and Twitter data, in order to build a consistent narrative of public engagement. One may also look for use of specific images relating to a given research project, and measure the proportion of posts which feature them. Second, there are valuable qualitative details that can be gathered from Reddit data. Each subreddit corresponds to a distinct community of people, united by a special interest. The different subreddits that discuss a particular research discovery then provide a cross-section of which societal groups have been enthused. Not only can this be used to classify the impact of a particular discovery, but it can also inform the design of future impact strategies.
In summary, we have described a number of different avenues for collecting online data related to public engagement with scientific research. Each of these in isolation tells an incomplete story, and must be used with care. In particular, one has little or no knowledge of the demographic associated with each online tool. Care should be taken to distinguish impact on the general public from increased engagement by fellow scientists or academics. However, even this latter case has some value as an engagement tool, by bringing formerly inaccessible scientific discussions into the public sphere as they occur (Cote and Darling, 2018; Walter et al., 2019; Giusta et al., 2021). By combining information from different sources, one can start to build up a more complete picture of how a given set of research results has entered the public consciousness, and generated discussion and/or debate. Let us now begin to do this, by focusing on specific examples.
Examples of specific research projects
The discovery of Proxima b
A significant focus of astronomical research in recent years has been the search for exoplanets, that is, planets which orbit stars other than our Sun. As well as the intrinsic interest in cataloguing celestial bodies outside our solar system, the study of exoplanets may reveal the existence of extraterrestrial life. This discovery would lead to a profound re-evaluation of our place in the universe, and would have far-reaching implications for the philosophy and religious faiths of humans around the world. In 2016, the Pale Red Dot project discovered an exoplanet orbiting our nearest star, Proxima Centauri, which itself forms part of the Alpha Centauri star system (Anglada-Escudé et al., 2016). This remains the nearest exoplanet to Earth to be discovered. Furthermore, ongoing studies of its environment suggest that it may harbour conditions suitable for extraterrestrial life. These facts led to considerable media reporting and attention worldwide, including print, broadcast and online media. As discussed above, however, this does not by itself constitute impact of the discovery, given that merely encountering a news article does not necessarily amount to a change in the outlook, knowledge or attitudes of the observer. In order to measure the latter, we have used the computational methods discussed in the previous section to construct a database of over 57,500 tweets relating to ‘Proxima Centauri’. Our use of this particular search term is motivated by its being the name of the parent star about which the newly discovered Proxima b orbits. Discovery of the star predates the discovery of Proxima b, such that we would expect increased discussion relating to Proxima Centauri to correlate with key dates in the discovery timeline of Proxima b. We have also accrued 4,910 news comments (from the Daily Mail, Guardian and BBC websites); 1,583 Reddit posts relating to Proxima b from 484 distinct subreddits; and Wikipedia information using Pageviews Analysis. This allows us to provide evidence for increased public engagement with astronomy topics relating to exoplanets, Proxima Centauri and the likelihood of extraterrestrial life.
Figure 2(a) shows the number of retweets which contain the term ‘Proxima Centauri’. We chose retweets rather than tweets, as these indicate a more active engagement by Twitter users, who have thus explicitly chosen to rebroadcast a particular piece of information. Figure 2(b) shows the number of replies to tweets featuring the same search term. Both plots start with a gentle rise in discussion, which comparison with Figure 1 reveals is not due to increased public engagement with astronomy, but rather to the increase in the number of global Twitter users. Nevertheless, the most dramatic feature in both Figures 2(a) and 2(b) is a highly pronounced spike in activity coinciding with the discovery year (2016) of Proxima b. The number of global retweets for the selected search term was over 23 times higher than the four-year average pre-discovery, and the annual average post-discovery is almost 8 times the average pre-discovery. This is far in excess of the rise in the number of Twitter users in this period. Furthermore, the trend in engagement post-discovery is upward, indicative of a sustained impact, as Proxima b enters wider popular culture, with increased media references.
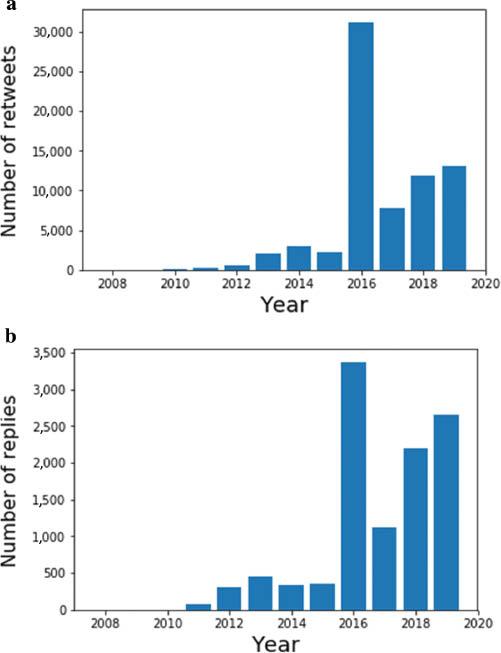
(a) The number of retweets per year relating to the search term ‘Proxima Centauri’; (b) the number of Twitter replies (Source: Authors, 2022)
A similar story is told by the Wikipedia data: Figure 3 shows the number of views of the Wikipedia pages about Proxima Centauri (in 73 languages) as a function of time. A significant spike is seen around discovery, and a sustained increase in activity occurs afterwards. To quantify this, we may avoid the spike by calculating the average number of views after 1 October 2016, and before 1 August 2016. We then find an average increase in engagement of 30 per cent, amounting to 20,000 extra views per month. On Reddit, there were over 350 posts on the discovery date itself, and there has been sustained activity since, with around 4.7 posts per week on average.
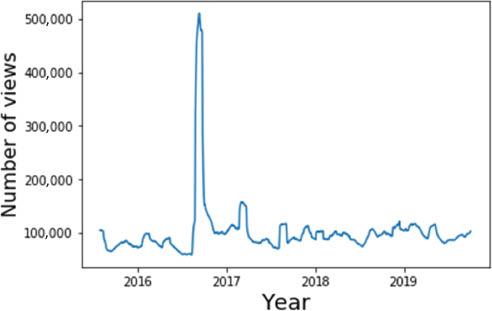
Daily viewing figures for Wikipedia articles about Proxima Centauri in 73 languages, where the curve has been smoothed with a 30-day rolling average (Source: Authors, 2022)
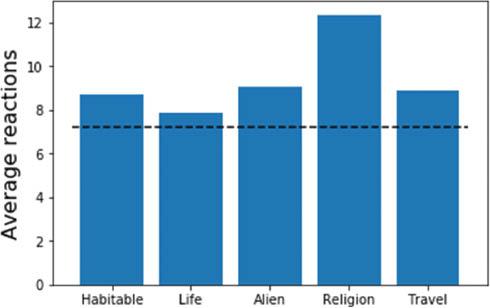
The quantitative results above show increased engagement of the public with astronomy related to the discovery of Proxima b. Further valuable insights on the nature of the impact can be gained by examining qualitative data. First, we may perform a keyword analysis on the collected texts in our database of tweets. Figure 4 shows the average number of retweets and replies for tweets containing certain keywords. Depending on which measure is used, above-average activity is strongly associated with the concept of habitability. Our other chosen keywords demonstrating above-average engagement are clearly related to the potential existence of extraterrestrial life, and we found that the number of tweets containing the words ‘habitable’, ‘water’, ‘alien’ or ‘life’ strongly increased after the 2016 discovery, an increase that continued thereafter. Similar results arise from analysing our collected news comments: Figure 5 shows the average number of reactions for news comments containing various keywords. As well as corroborating the interest in alien life, above-average engagement is also observed for comments discussing the implications of the discovery for religion, as well as the possibility of interstellar travel to the exoplanet. (The latter was well-publicised after a press conference for the Breakthrough Foundation, who initiated a project to send small spacecraft to Proxima b.) This consistency of popular keywords across different media platforms significantly supports the hypothesis that public interest in the Proxima b discovery focuses on its implications for the existence of life outside our solar system.
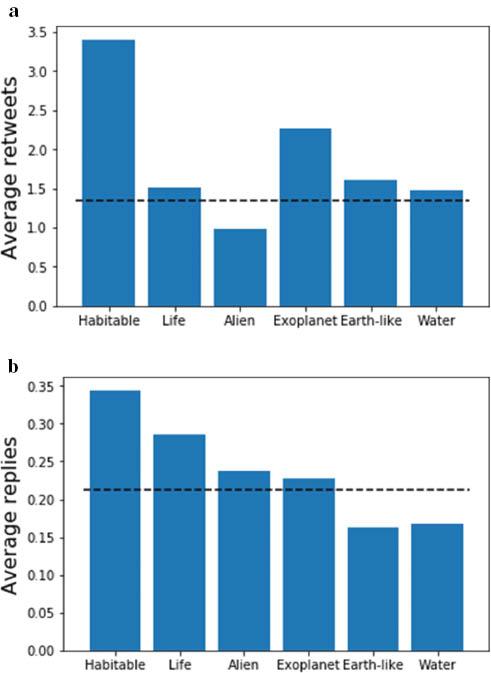
(a) The average number of retweets for tweets containing ‘Proxima Centauri’, containing certain keywords; (b) similar, but for replies. In each case, the dashed line indicates the average activity for all ‘Proxima Centauri’ tweets (Source: Authors, 2022)
Average number of reactions for news comments containing certain keywords; the dashed line denotes the average for all comments in the selected articles (Source: Authors, 2022)
The Twitter data already provides evidence that more people are finding out about Proxima Centauri as a result of the Proxima b discovery. It is also possible to show this using the Wikipedia data. In particular, one may look at correlations between viewing figures for various Wikipedia articles. Proxima Centauri b (to use the full name of the exoplanet) has had its own Wikipedia article since 24 August 2016. One may then plot the viewing figures for related articles on a particular day, versus the viewing figures for the Proxima b article. (Given that the Proxima b article appeared originally only in English, we have chosen to compare correlations with related articles in a single language.) Figure 6 shows this for the articles ‘Proxima Centauri’ and ‘Exoplanet’. There is a clear correlation in each case, suggesting that people who are reading about Proxima b are in turn seeking out more information on the host star, or on exoplanet research in general. The positive correlation can be quantified in each case by the well-known Pearson correlation coefficient, which is 1 for complete (positive) correlation, and 0 for no correlation. The Pearson coefficients are 0.84 and 0.30 for the ‘Proxima Centauri’ and ‘Exoplanet’ articles respectively, with negligible uncertainties. (One may worry that the statistical assumptions underlying the use of the Pearson coefficient – that of a linear relationship, and Gaussian uncertainties for the viewing figures – do not apply here. An alternative is to use the Spearman coefficient, which evaluates to 0.72 and 0.37 for the two cases.) Correlation does not imply causation in general, and there are known statistical problems when comparing time series of data, as we are doing here. However, the fact that the Wikipedia correlation agrees with similar conclusions reached from the social media data means that one can be confident that a genuine correlation is being observed.
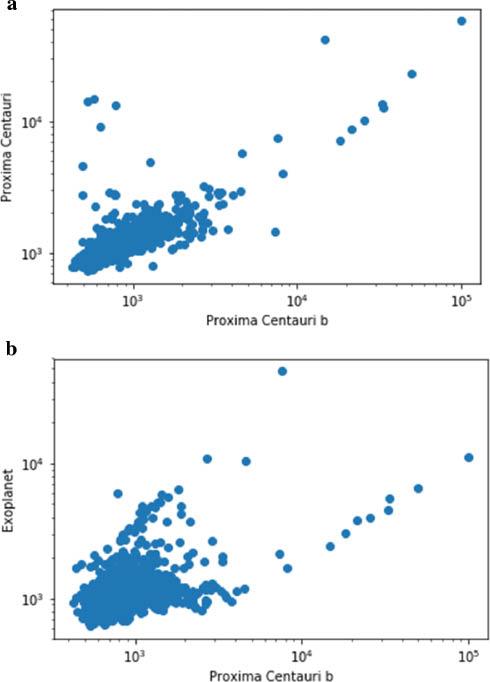
Viewing figures for Wikipedia articles – (a) ‘Proxima Centauri’ and (b) ‘Exoplanet’ – plotted against the viewing figures for the article ‘Proxima Centauri b’, taken on the same day (Source: Authors, 2022)
In addition to the keyword analysis above, one may examine which groups of people were particularly influenced by the Proxima b discovery. The Reddit communities with the highest proportion of Proxima b posts include one focused on creative writing and another dedicated to exhibiting the awesome potential of humanity, indicating that Proxima b has uniquely captured public imagination beyond typical astronomy-interested audiences.
The Cassini–Huygens mission
As a second example of research with a significant public engagement component, we use the results of the Cassini–Huygens probe. This was a NASA satellite mission, which reached the planet Saturn in 2004. It then spent 13 years orbiting the planet, performing detailed observations of its ring systems and moons, including Enceladus and Titan, which are thought to be potentially habitable by microbial extraterrestrial life. In September 2017, the mission culminated in a spectacular ‘Grand Finale’ phase, in which the probe was destroyed by intentionally crashing into Saturn, in order not to contaminate the nearby moons. During its lifetime, the Cassini–Huygens mission captured over four hundred thousand images of Saturn and its environs. These generated new research results in planetary mechanics, but also gained widespread public interest. One picture in particular – dubbed ‘Cassini’s most iconic image mosaic’ by NASA Project Scientist Linda Spilker – featured a high-resolution shot of Saturn, with the Earth as a tiny speck in the background. The striking poignancy of the image – titled The Day the Earth Smiled – was highlighted by news outlets around the world. Likewise, the Grand Finale phase of the mission also received widespread media attention.
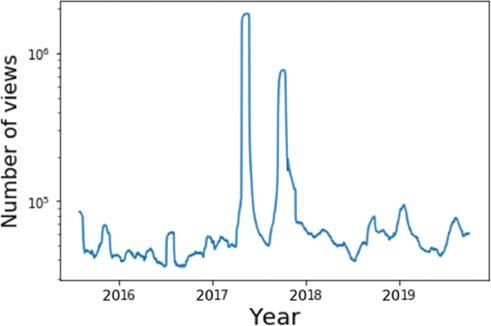
Similar to the exoplanet discovery discussed above, the Cassini mission is able to potentially stimulate public interest in astronomy. It may also have changed the status quo regarding how society at large both visualises and understands Saturn. Proving this retrospectively, however, poses different challenges to the previous example. Despite the fact that iconic images have been produced – whose (re-)use in online media can potentially be traced – there is not necessarily a clear demarcation between ‘before’ and ‘after’ when it comes to discussing Saturn. In the exoplanet example, the term ‘Proxima b’ did not exist before the discovery of the planet, so any discussion of its properties constitutes a shift in public understanding. This is not the case with Saturn, such that different ways of thinking about its impact are needed. Nevertheless, similar techniques may be used in building a coherent narrative for public behavioural (or other) change. To this end, we have amassed 223,000 tweets relating to the search string ‘Saturn Cassini’, from 2013 onwards; 6,080 comments from news articles relating to Cassini on the Daily Mail, Guardian and BBC websites; 12,300 comments from YouTube videos relating to Cassini; over 125,000 Reddit posts relating to Saturn in over 12,000 distinct subreddits; and Wikipedia page-view data using Pageviews Analysis.
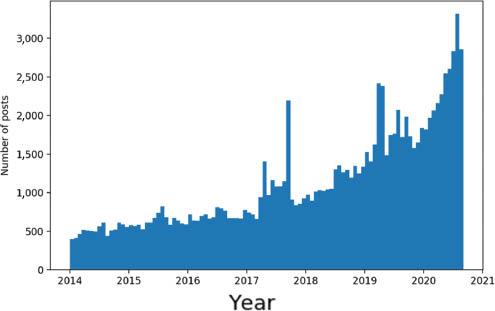
Quantitative evidence for a sustained increase in public engagement with the mission is revealed in the Twitter data. Figure 7 shows the number of retweets and replies to tweets relating to ‘Saturn Cassini’, which demonstrate a clear peak in engagement throughout the Grand Finale year; for example, there were over 287,000 retweets in 2017, 9.5 times higher than the mean in the preceding three years. There is also a sustained increase thereafter, showing widespread engagement with the legacy of the mission. Our Reddit data also shows a sustained increase in engagement with Saturn-related content. After the peak in 2017, the number of posts initially returned to a similar baseline, but increased rapidly, up to around 3,000 posts per week at the conclusion of our study (Figure 8). Wikipedia data confirms this picture. We found, for example, that page views for Wikipedia’s articles on Saturn spiked by approximately a factor of nine during the Grand Finale orbit. Figure 9 shows the viewing figures for articles on the Cassini–Huygens mission (in 72 languages). The two large spikes correspond to the start and end of the Grand Finale orbit, which both received significant press attention. In the case of Cassini, one expects that it has set a new paradigm in how we visualise Saturn, in that its images have become definitive, even among the general public. This can be evidenced by looking at our Reddit data, and in particular at the number of image-related posts about Saturn. In a sample of 5,645 posts, we found that 18 per cent feature Cassini images, showing that significant numbers of people are choosing Cassini results to illustrate their discussions.
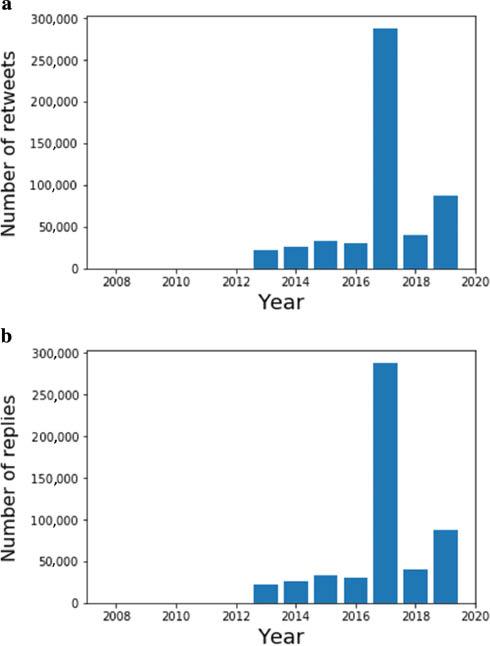
(a) The number of retweets per year relating to the search term ‘Saturn Cassini’; (b) the number of Twitter replies (Source: Authors, 2022)
Daily viewing figures for Wikipedia articles on Cassini–Huygens in 72 languages; the curve has been smoothed with a 30-day rolling average (Source: Authors, 2022)
As for the exoplanet discovery, one may perform a keyword analysis to see which aspects of Cassini science are the drivers of public engagement. Interest in the moons (for example, Titan) is evident, as are new results on the ring system. The keyword ‘Earth’ gets the most attention, which is tied to the iconic The Day the Earth Smiled image mentioned above. Interestingly, engagement as measured by replies to tweets (perhaps a measure of more active engagement) is significantly higher than average, as compared with retweets (Figure 10). This story is replicated by reaction data taken from news article comments, and from YouTube videos (Figure 11). In the latter case, interest can also be seen in Enceladus (another of Saturn’s moons). Comments which explicitly talk about the wonder conveyed by Cassini images (as measured by the word ‘amazing’) also lead to increased engagement.
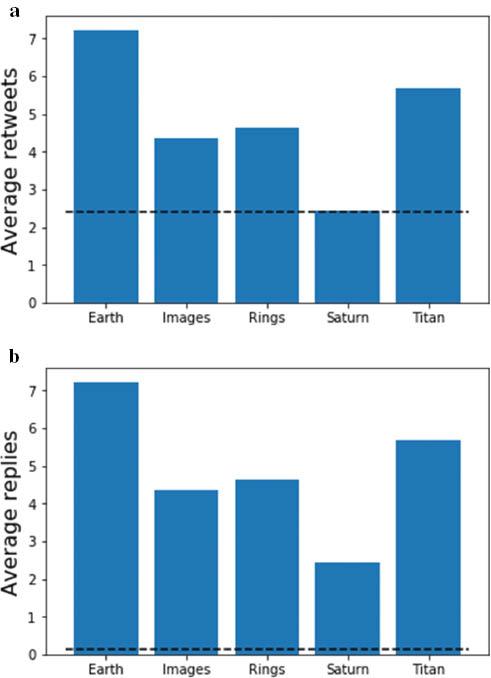
(a) The average number of retweets for tweets containing ‘Saturn Cassini’, containing certain keywords; (b) similar, but for replies. Dashed lines indicate the average activity for all ‘Saturn Cassini’ tweets (Source: Authors, 2022)
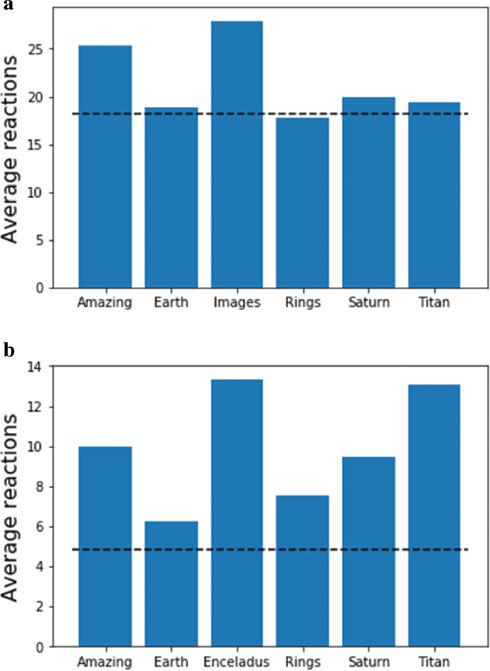
The average number of reactions for comments relating to the Cassini mission, from (a) news articles; (b) YouTube videos. Also shown is the average number of reactions across all comments (Source: Authors, 2022)
Evidence for the public educating themselves can again be gleaned by looking at correlations of Wikipedia page views. Figure 12 shows the page views for articles related to the ‘Cassini–Huygens’ article (across all languages), compared with the article itself. There is a clear correlation with people reading about Saturn in general, or about the ring system: the respective Pearson correlation coefficients are 0.43 and 0.70, with negligible uncertainties. (The respective Spearman correlation coefficients are 0.35 and 0.39, again with negligible uncertainties.) As for our previous research example, the fact that the keyword analysis tells a similar story of engagement means that we can be confident that a genuine correlation is being observed.
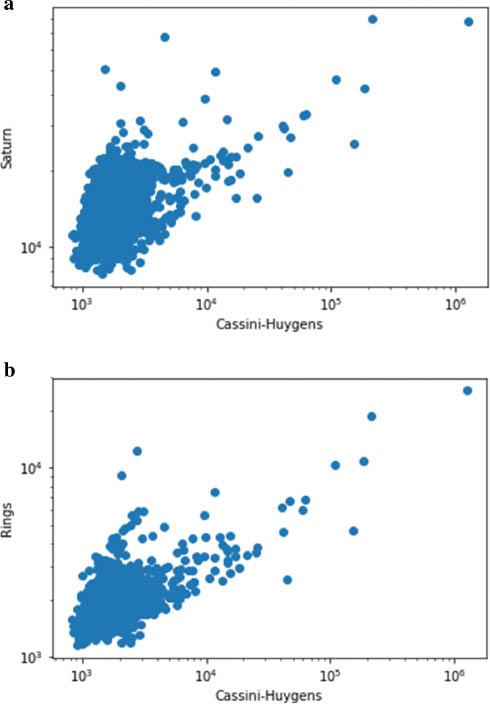
Viewing figures for Wikipedia articles – (a) ‘Saturn’ and (b) ‘Rings’ – plotted against the viewing figures for the article ‘Cassini–Huygens’, taken on the same day (Source: Authors, 2022)
Further qualitative insights can be gained by looking at which Reddit subforums users are engaging with. We found that the top 20 subreddits for Cassini-related discussions include 9 focused on general photography and general interest posts. In 2019–20, there was an average of five posts a week, even on advanced topics such as the moon Enceladus. Thus, the image-related aspect of the Cassini mission has indeed informed discussions in communities outside typical science channels. Unsurprisingly, Reddit posts with the most upvotes convey inspiration and wonder; we found multiple posts with more than 10,000 upvotes and/or more than 1,000 comments. Qualitative information from comments can be highly useful. In our database of combined news and YouTube comments, for example, we found evidence of:
Increased understanding of space exploration, for example, ‘$4bn well spent – the knowledge Cassini has provided has broadened our understanding of our Solar System and hopefully paved the way for future manned exploration’ (a news comment with 342 reactions).
Specific references to scientists from particular institutions (this can be useful for assessment exercises such as the REF).
Debate and discussion about complex scientific topics. In the Cassini case, the YouTube comments show people discussing the nature and structure of Saturn’s rings (for example, ‘Saturn has moons between its rings that produce ripples in the rings through gravity… interesting!’); why the Cassini mission flew into Saturn, and the proof that it did so; and the nature of the instrumentation on board, and how this influenced the reported images (for example, ‘Cassini’s speed is the reason these particular photos are only in greyscale and low resolution on this pass’).
Conclusion
In this paper, we have examined the problem of how to evidence the impact of well-publicised research discoveries on the general public, years after a given discovery took place. By exploiting the wealth of data available online, we have constructed narratives of increased public engagement for two example high-profile research projects: (1) the discovery of the exoplanet Proxima b in 2016; and (2) the Cassini–Huygens mission, which culminated in a spectacular Grand Finale in 2017. We have constructed our own computational tools for extracting and analysing Twitter data, Reddit posts, Wikipedia views, and news and YouTube comments. This is greatly advantageous to using pre-existing online metrics or tools, which would need to be tailored to be able to incorporate specialist research knowledge related to the projects at hand.
While each data type by itself may provide relatively weak evidence for behavioural (or other) change, the combination of several mutually corroborative elements leads to much stronger conclusions. We found convincing evidence for increased public awareness of astronomy topics; discussion and debate of advanced scientific concepts; and a sustained legacy of engagement with our chosen research results. This suggests that similar methods may prove useful in future, particularly for the kind of fundamental physics discoveries that – while highly publicised – can be tricky to describe in terms of the impact narratives required by assessment exercises such as the REF.
Our paper is a proof-of-concept study, and there are clearly many avenues for future research. The investigation of research projects which are not quite as high profile as the ones presented here would be interesting, as would the extension of our data sets to include more types of online data. It would also be possible to do a much more sophisticated analysis of our comment databases. One might think, for example, of applying sentiment analysis, natural language processing (or other machine learning) techniques in order to quantify how the public’s response to scientific content changes over time, or to quantify evidence of rigorous debate. This would also shed light on the robustness of our comment data, which may be polluted by negative or false information.
We emphasise that measuring engagement is not the same thing as measuring understanding, and that our methods, even if sentiment analysis is included, are better equipped to do the first of these. At this stage, it seems likely to us that reliable measures of understanding will require substantial input by human evaluators, and will therefore be restricted to smaller data sets.
Even if all comments and posts are genuine, they may be the work of scientists or those related to academia, rather than of laypeople. Although conversations between academics in public may have substantial engagement value, as we argue above, this is a different sort of engagement to conversations between scientists and the wider public, and our data does not currently distinguish between these. We leave the investigation of these interesting questions to future work, but hope that our present results already provide a useful counterpoint to the well-documented perception of public engagement as ‘risky’, given the challenges of evidencing it (Wilkinson, 2019; Watermeyer and Chubb, 2019).
Our approach may additionally offer a route towards greater engagement for academics who have been mistrustful of the impact agenda as a whole. Researchers occupied with fundamental rather than applied science, who feel a sense of moral obligation in justifying their research, may nonetheless feel marginalised by this agenda, particularly given that the demands of evidencing their impact may feel quite separate from those aspects of research that made them become scientists in the first place. We see it as significant that our techniques rely on the very same data science skills that are used widely throughout fundamental science, thus helping to enfranchise those researchers who may face an additional ‘emotional challenge’ in regard to the impact agenda (Chubb et al., 2017). Finally, we note that the increasing impact agenda, together with the rapid development of data science, provides ample scope for interdisciplinary collaboration in this area.